CENAGIS Centre
Data repository
How are the data stored in CENAGIS?
The following article describes the technologies used to organize the CENAGIS data repository.
The data in CENAGIS is a huge collection, diverse in subject matter and technology. Its description is worth starting by showing its place in the CENAGIS system architecture.
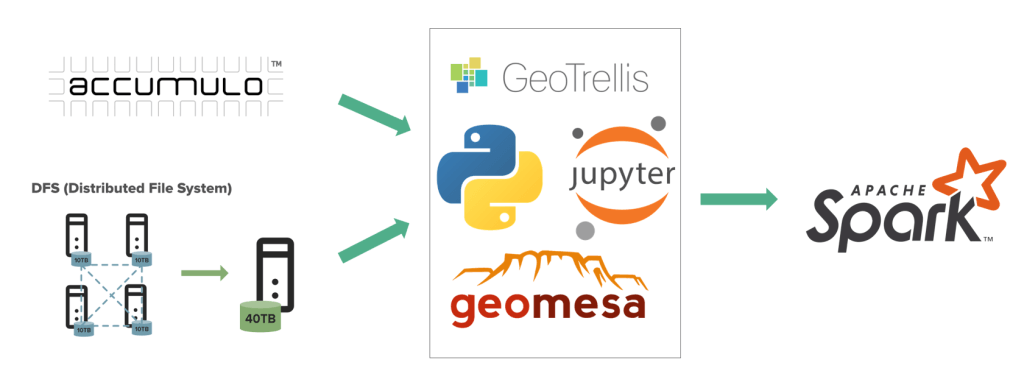
The data structures in the CENAGIS system architecture were designed to take advantage of all available spatial data repositories. Their diverse thematic scopes and different data models were taken into account. When designing the architecture, the requirements posed by the huge size of the data and the assumed methods of its use by users were also taken into account. For this reason, data is embedded in relational and non-relational databases and the file system. This is illustrated in Figure 1.
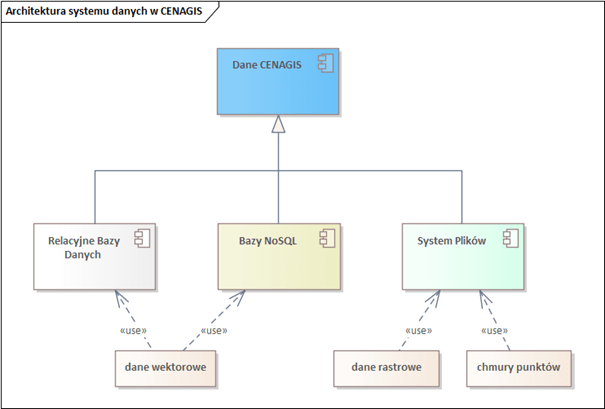
The first of the technical solutions are relational databases. The tool of choice is PostgreSQL with the PostGIS extension. This database engine is used in two areas: in the central data cluster and on client machines – in their virtual labs.
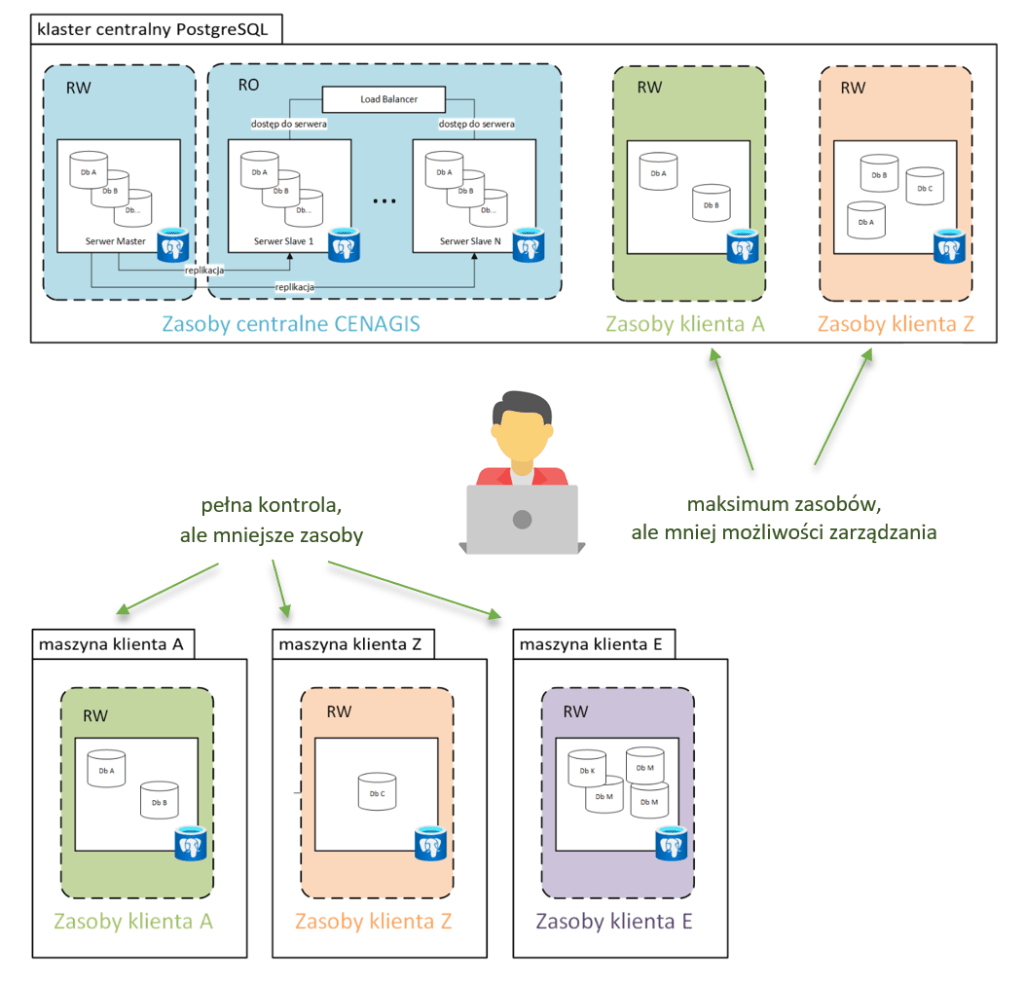
Figure 2 shows the mentioned areas. In the upper part is the central database cluster. The lower part shows the users’ virtual machines. A cluster (in blue) is a structure formed from several physical machines, which guarantees high data access efficiency and security. The central repository of CENAGIS vector data is located in this cluster.
Here you can see a machine labelled RW (Read Write), this is the Master server that allows you to manage the central repository. To the right of it are several Slave machines to which data is replicated from the Master server. The user can access these machines in Read Only mode. From his perspective, the structure is visible as a single repository.
In the central cluster, you can also see separate items colored green and orange. These mark the databases that can be set up at the user’s request. The data will be copied to these databases during ETL processes carried out by the user or (at the user’s request) by CENAGIS staff.
The lower part symbolically shows the customer machines on which PostgreSQL servers will be preinstalled. When should a user decide to set up a database in a central cluster, and when on his machine? It depends on his planned activities and the resulting needs. Deciding to set up a database in the central server area, you gain in performance (you use the resources of a cluster configured to work under a heavy load), but you lose many privileges you would like to have as a database administrator. By putting the database on your Virtual Machine, you lose performance but gain complete administrative control of your database.
Relational databases are used to store vector data in a well-defined structure. CENAGIS is a BIG DATA system, i.e., it allows analysis using distributed computing in Apache Spark and Hadoop on big data resources. In this approach, relational databases will not work. The solution is GEOMESA, GIS software that works with Apache Spark and Hadoop. GeoMesa uses a NoSQL database, Accumulo, to store the data. NoSQL databases are those operating in a distributed architecture whose data model is not relational.
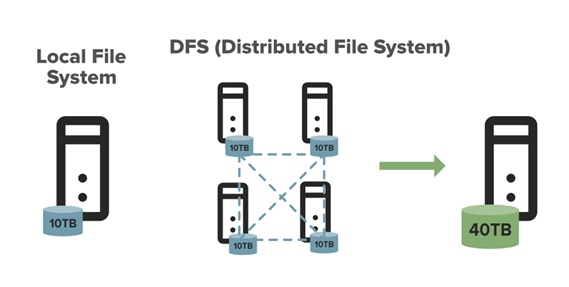
Non-vector model data, i.e. rasters and point clouds, are stored in a file system. CENAGIS uses the Hadoop Distributed File System (HDFS) solution. This distributed file system stores data on regular machines, providing very high aggregate throughput across the cluster.
HDFS is specific in its operation. Copying and deleting data is implemented here with a separate set of commands (somewhat similar to those known from Linux). However, only an advanced user will encounter this – for example, in Jupyter Hub. An ordinary user who wants to perform GIS analysis on his virtual machine will not notice it. For him, the resources have been mapped to allow access using standard techniques known from Windows.
The user’s access to the data varies depending on its model and the type of structure in which it is embedded.
The user can view metadata and data through applications using CKAN, Geonetwork, Terria, ERDAS Apollo technologies when searching for data. How will a CENAGIS user learn what data he can use, how to acquire it, and what tools to do it with? He will find out from the documentation (wikis and guides available from the CENAGIS access panel).
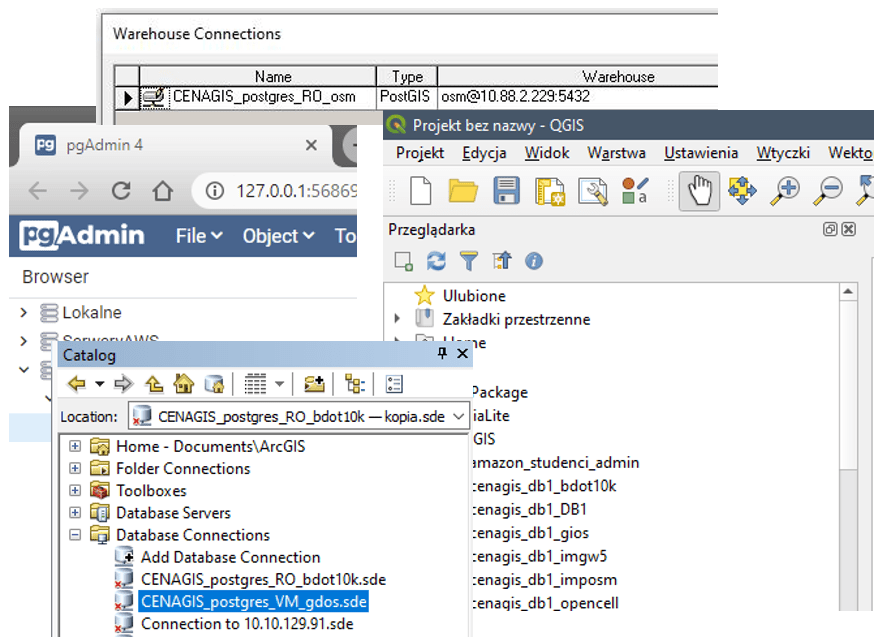
The user will get to the data from relational databases, among other things, through links defined in GIS applications installed on virtual machine templates. It is worth mentioning at this point that the data model used by the user in CEANGIS is also profiled for the software being used. For example, separate repositories of so-called enterprise geodatabases have been created for users of ESRI software. For a user who wants to use SQL language, pgAdmin – a client for PostgreSQL database maintenance – is installed on each machine. Jupyter Notebooks users can use Python language with a built-in psycopg2 library.
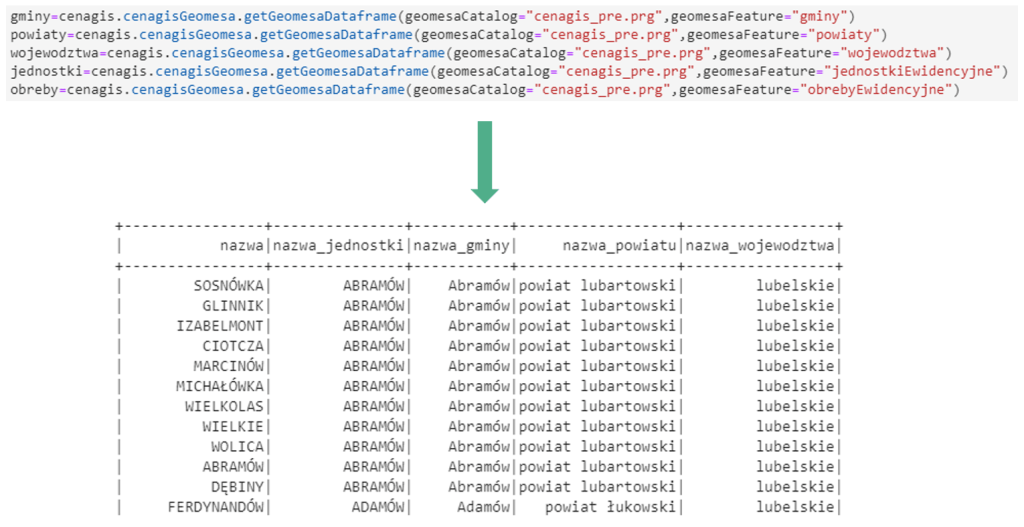
Accessing Big Data requires more IT skills. Big Data analysis software uses data in HDFS and Accumulo databases. A CENAGIS Big Data environment user does not have direct access to the Accumulo database. Working with the Big Data environment is done through Jupyter Notebook, which uses Python to outsource data operations to GeoMesa.
List of available data
Vector data
- Topographic Objects Database BDOT10k,
- 3D building data from the project CAPAP,
- Land and building register (buildings, parcels),
- National Register of Boundaries (administrative units, special boundaries, streets, address points),
- National Register of Geographical Names (names of places, physiographic objects).
- Forest Data Bank (et al. boundaries of forest administration units, separations)
- SDI data (et al. ecological corridors, mesoregions, protected landscape areas, special protection areas, national and landscape parks, reserves, natural monuments …),
- CORINE,
- Water and air monitoring data.
- units of statistical division of the country,
- population data from the 2021 census,
- Local Data Bank.
- Measurement stations/posts, meteorological observation data.
- Historical monuments, UNESCO sites, architectural monuments, immovable monuments.
- Flood hazard maps, flood risk maps.
- et al. data on BTS stations, collocations, hot-spots, lines, nodes, services, planned investments.
- data (two data models),
- map service,
- routing services,
- geocoding service.
- OpenCell ID (mobile network transmitter database),
- GDELT
Raster data
- orthophotomaps
- current and archival,
- At resolutions <10 cm, 10 cm, 25 cm, 50 cm, >50 cm ( archival),
- elevation data from laser scanning
- Digital Elevation Model, 1 m resolution,
- Digital Surface Model, resolution 0.5 m (cities), 1 m (others),
- generalized models,
- derived models (e.g., inheritance maps).
- Sentinel-1, Sentinel-2, Sentinel-3, Sentinel-5P – entire archive, area of Europe,
- Landsat 5 (1984-2011), Landsat 7 (1999-2017), Landsat 8 (2013-now) – area of Europe,
- Envisat (2002-2012), SMOS (2010-now) – the entire world,
- Jason-3,
- Copernicus thematic services data – Atmosphere, Climate, Emergency, Land, Marine,
- S2GLC land cover type database,
- DEM (Mapzen, SRTM, Copernicus).
Point clouds
- Measurement data from laser scanning in *.laz format
- Integrated data for the whole area of Poland in the form of Cesium 3D Tiles
Public access database
One of the planned components of the Center is a publicly accessible database designed to store and share research results following FAIR principles.
FAIR principles mean that the data are:
- Findable,
- Accessible,
- Interoperable,
- Reusable.